|
|
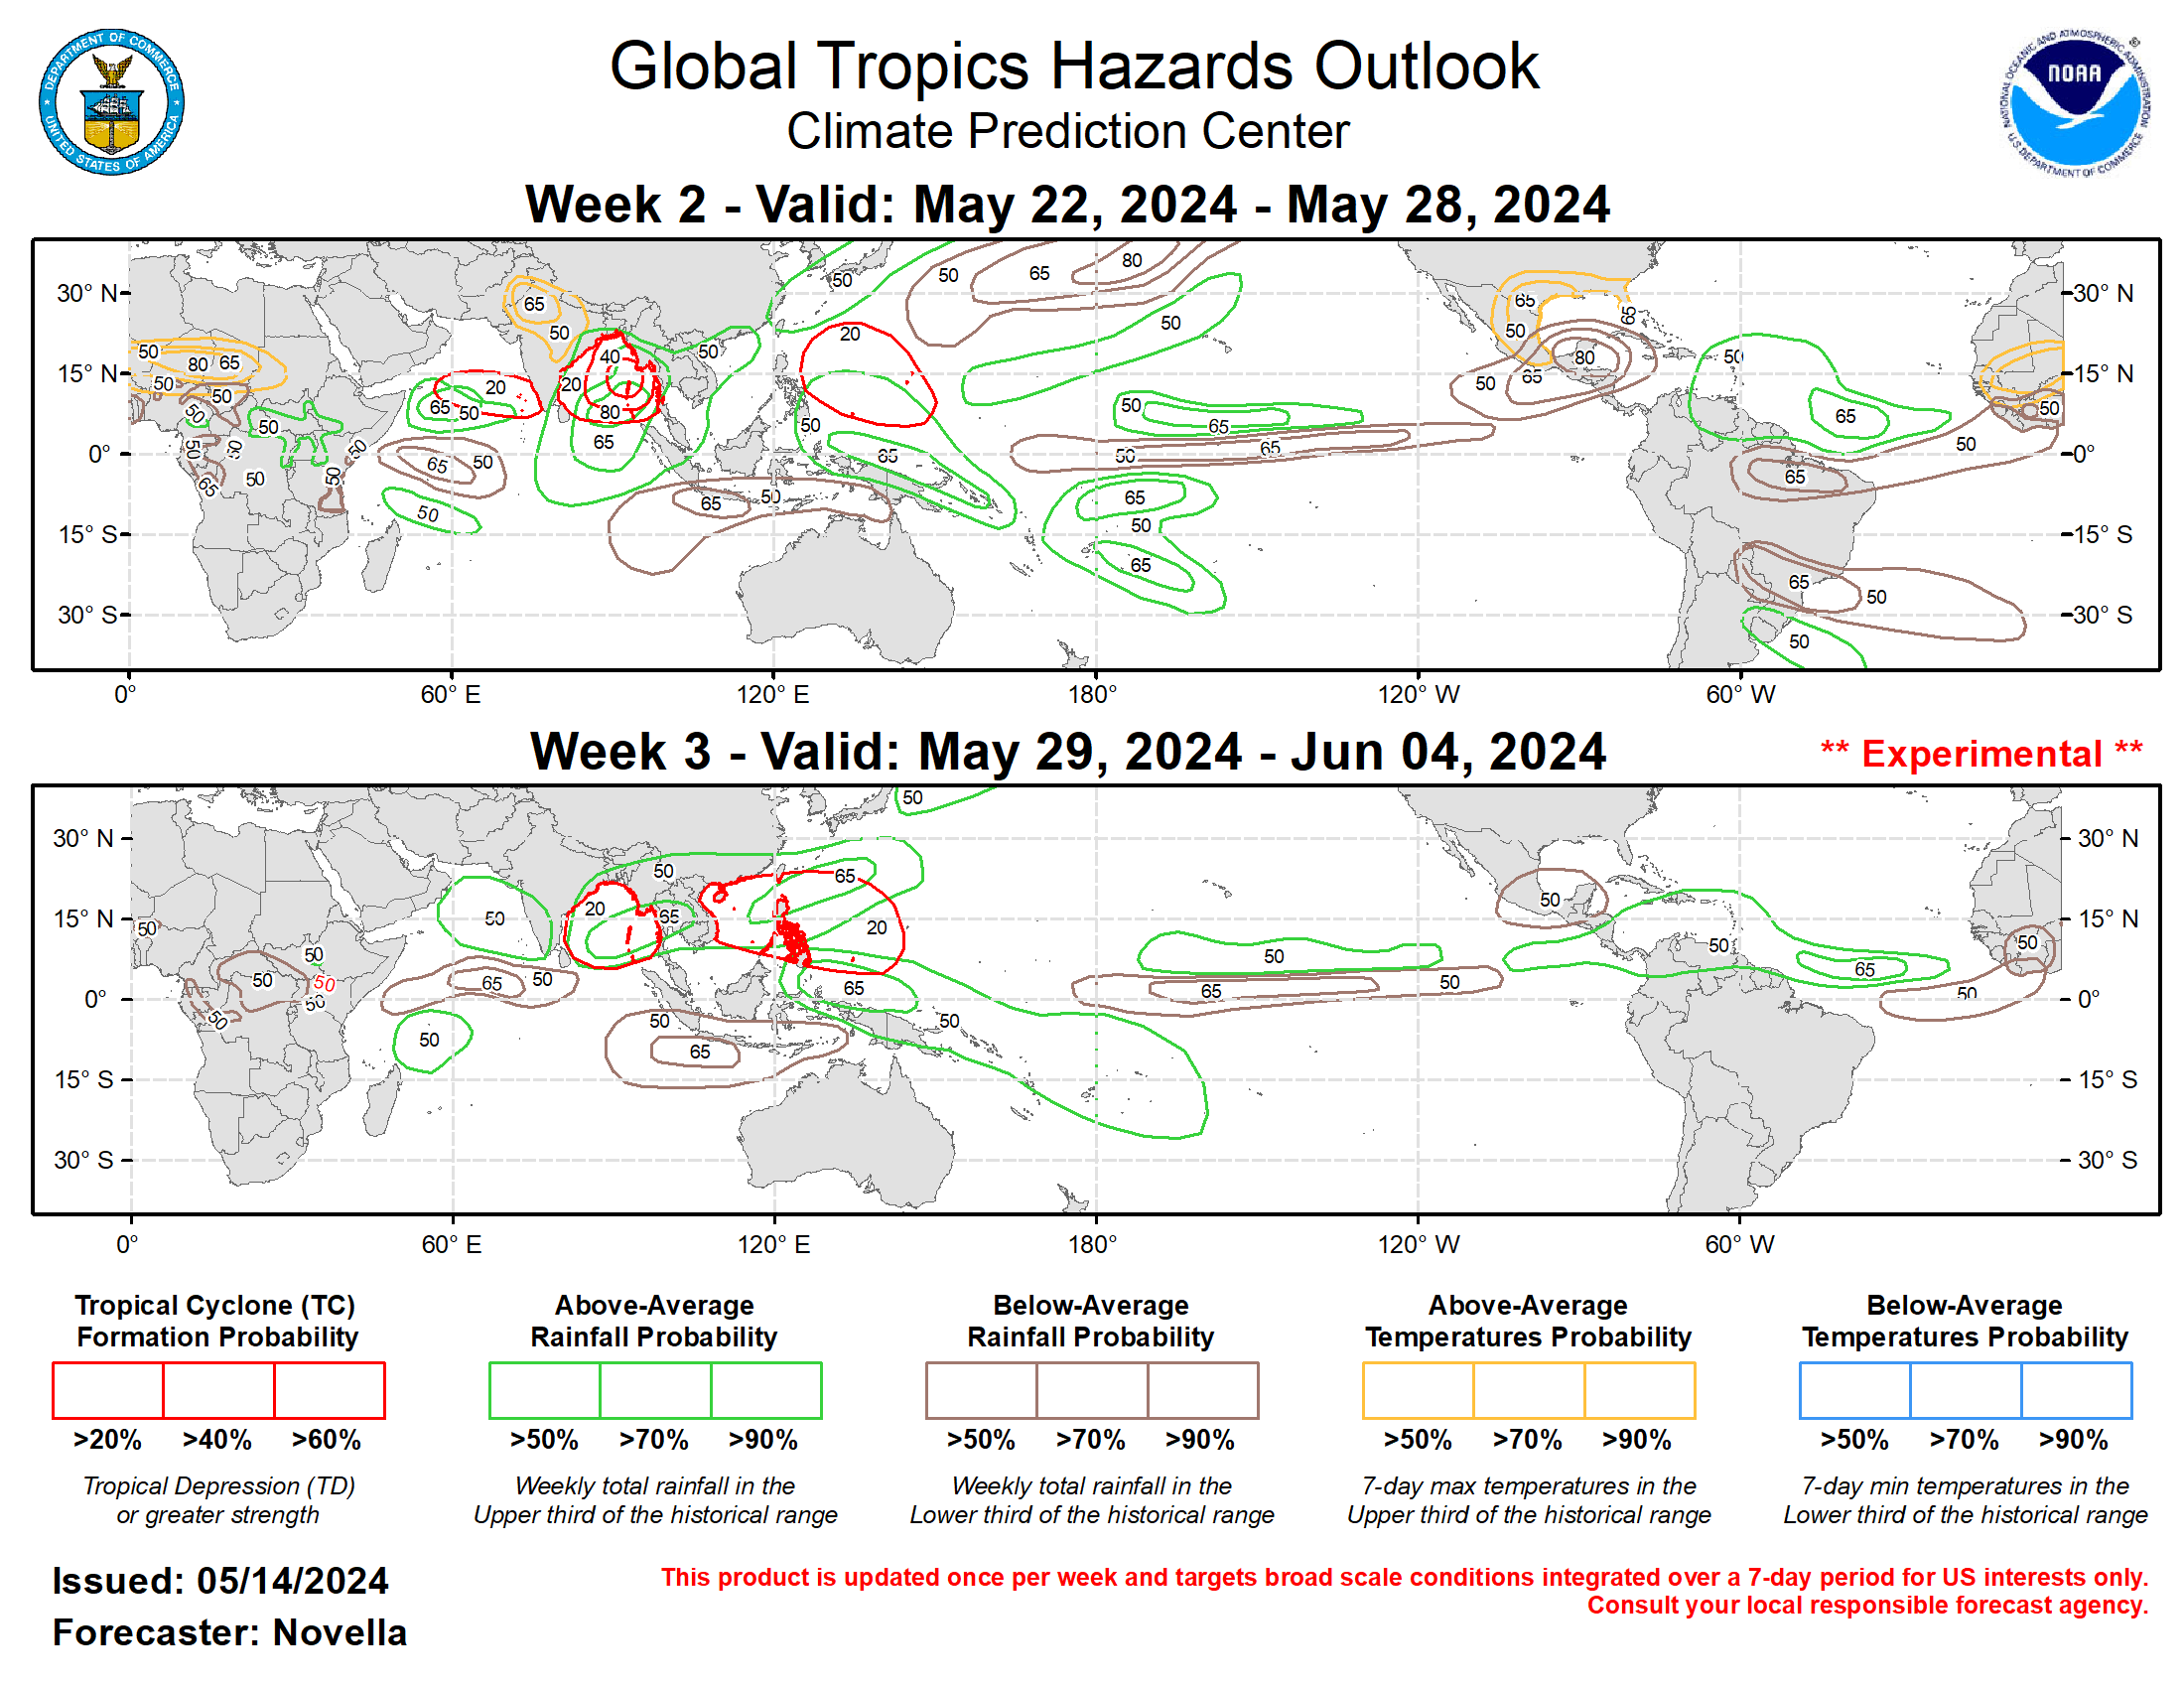
GTH Outlook Map and Data
|
Last Updated -
04/08/25
|
|
|
|
|
|
GTH Outlook Discussion
|
Last Updated -
04/08/25
|
Valid -
04/16/25 - 04/29/25
|
After the Madden-Julian Oscillation (MJO) entered the Western Pacific last month, RMM observations continue to show the enhanced phase remaining weak while exhibiting an erratic propagation across the basin. This incoherence is likewise reflected in the upper-level velocity potential anomaly observations, which suggest that the MJO has been stymied by other modes of tropical variability, namely strong equatorial Kelvin wave activity, and a pair of low frequency responses in the equatorial eastern Pacific and Maritime Continent associated with a complex base state. This has resulted in multiple envelopes of enhanced divergence aloft over the past few weeks, inconsistent with a canonical MJO pattern.
Looking ahead, RMM forecasts generally favor a signal that quickly circumnavigates the RMM origin at a low amplitude and returns to the Western Pacific during the next week or so. Given the fast phase speed favored, the thinking is that these forecasts are latching onto the aforementioned Kelvin wave activity that eventually relaxes during week-2, which is supported in the objectively wave filtered OLR and upper-level velocity potential forecast fields from the dynamical models. Unlike the RMM perspective, these filtered fields depict an MJO envelope that stays dormant within the Eastern Hemisphere on the near term, before resuming a more canonical eastward propagation across the Western Pacific and Western Hemisphere, with much of the enhanced divergence aloft being expressed south of the equator during the next several weeks (likely due to the suppressed convective La Nina footprint north of the equator in the central Pacific). As the main MJO envelope begins to overspread the Western Hemisphere in the velocity potential forecasts, there is some model support for a better defined wave-1 pattern taking shape towards the end of April. This potential for reorganizing subseasonal activity is also evidenced in the RMM forecasts at the extended leads, where there are a growing number of ensemble members in the GEFS and CFSv2 favoring a high amplitude event by the week-3 timeframe. Therefore, the updated outlook is not ruling out a more coherent MJO unfolding later this month, but there remains a good deal of uncertainty given the ongoing multiple modes of tropical variability and their associated convective responses. There is also low confidence in the outlook for Tropical Cyclone (TC) development amidst a quiet background climatology, especially during late April.
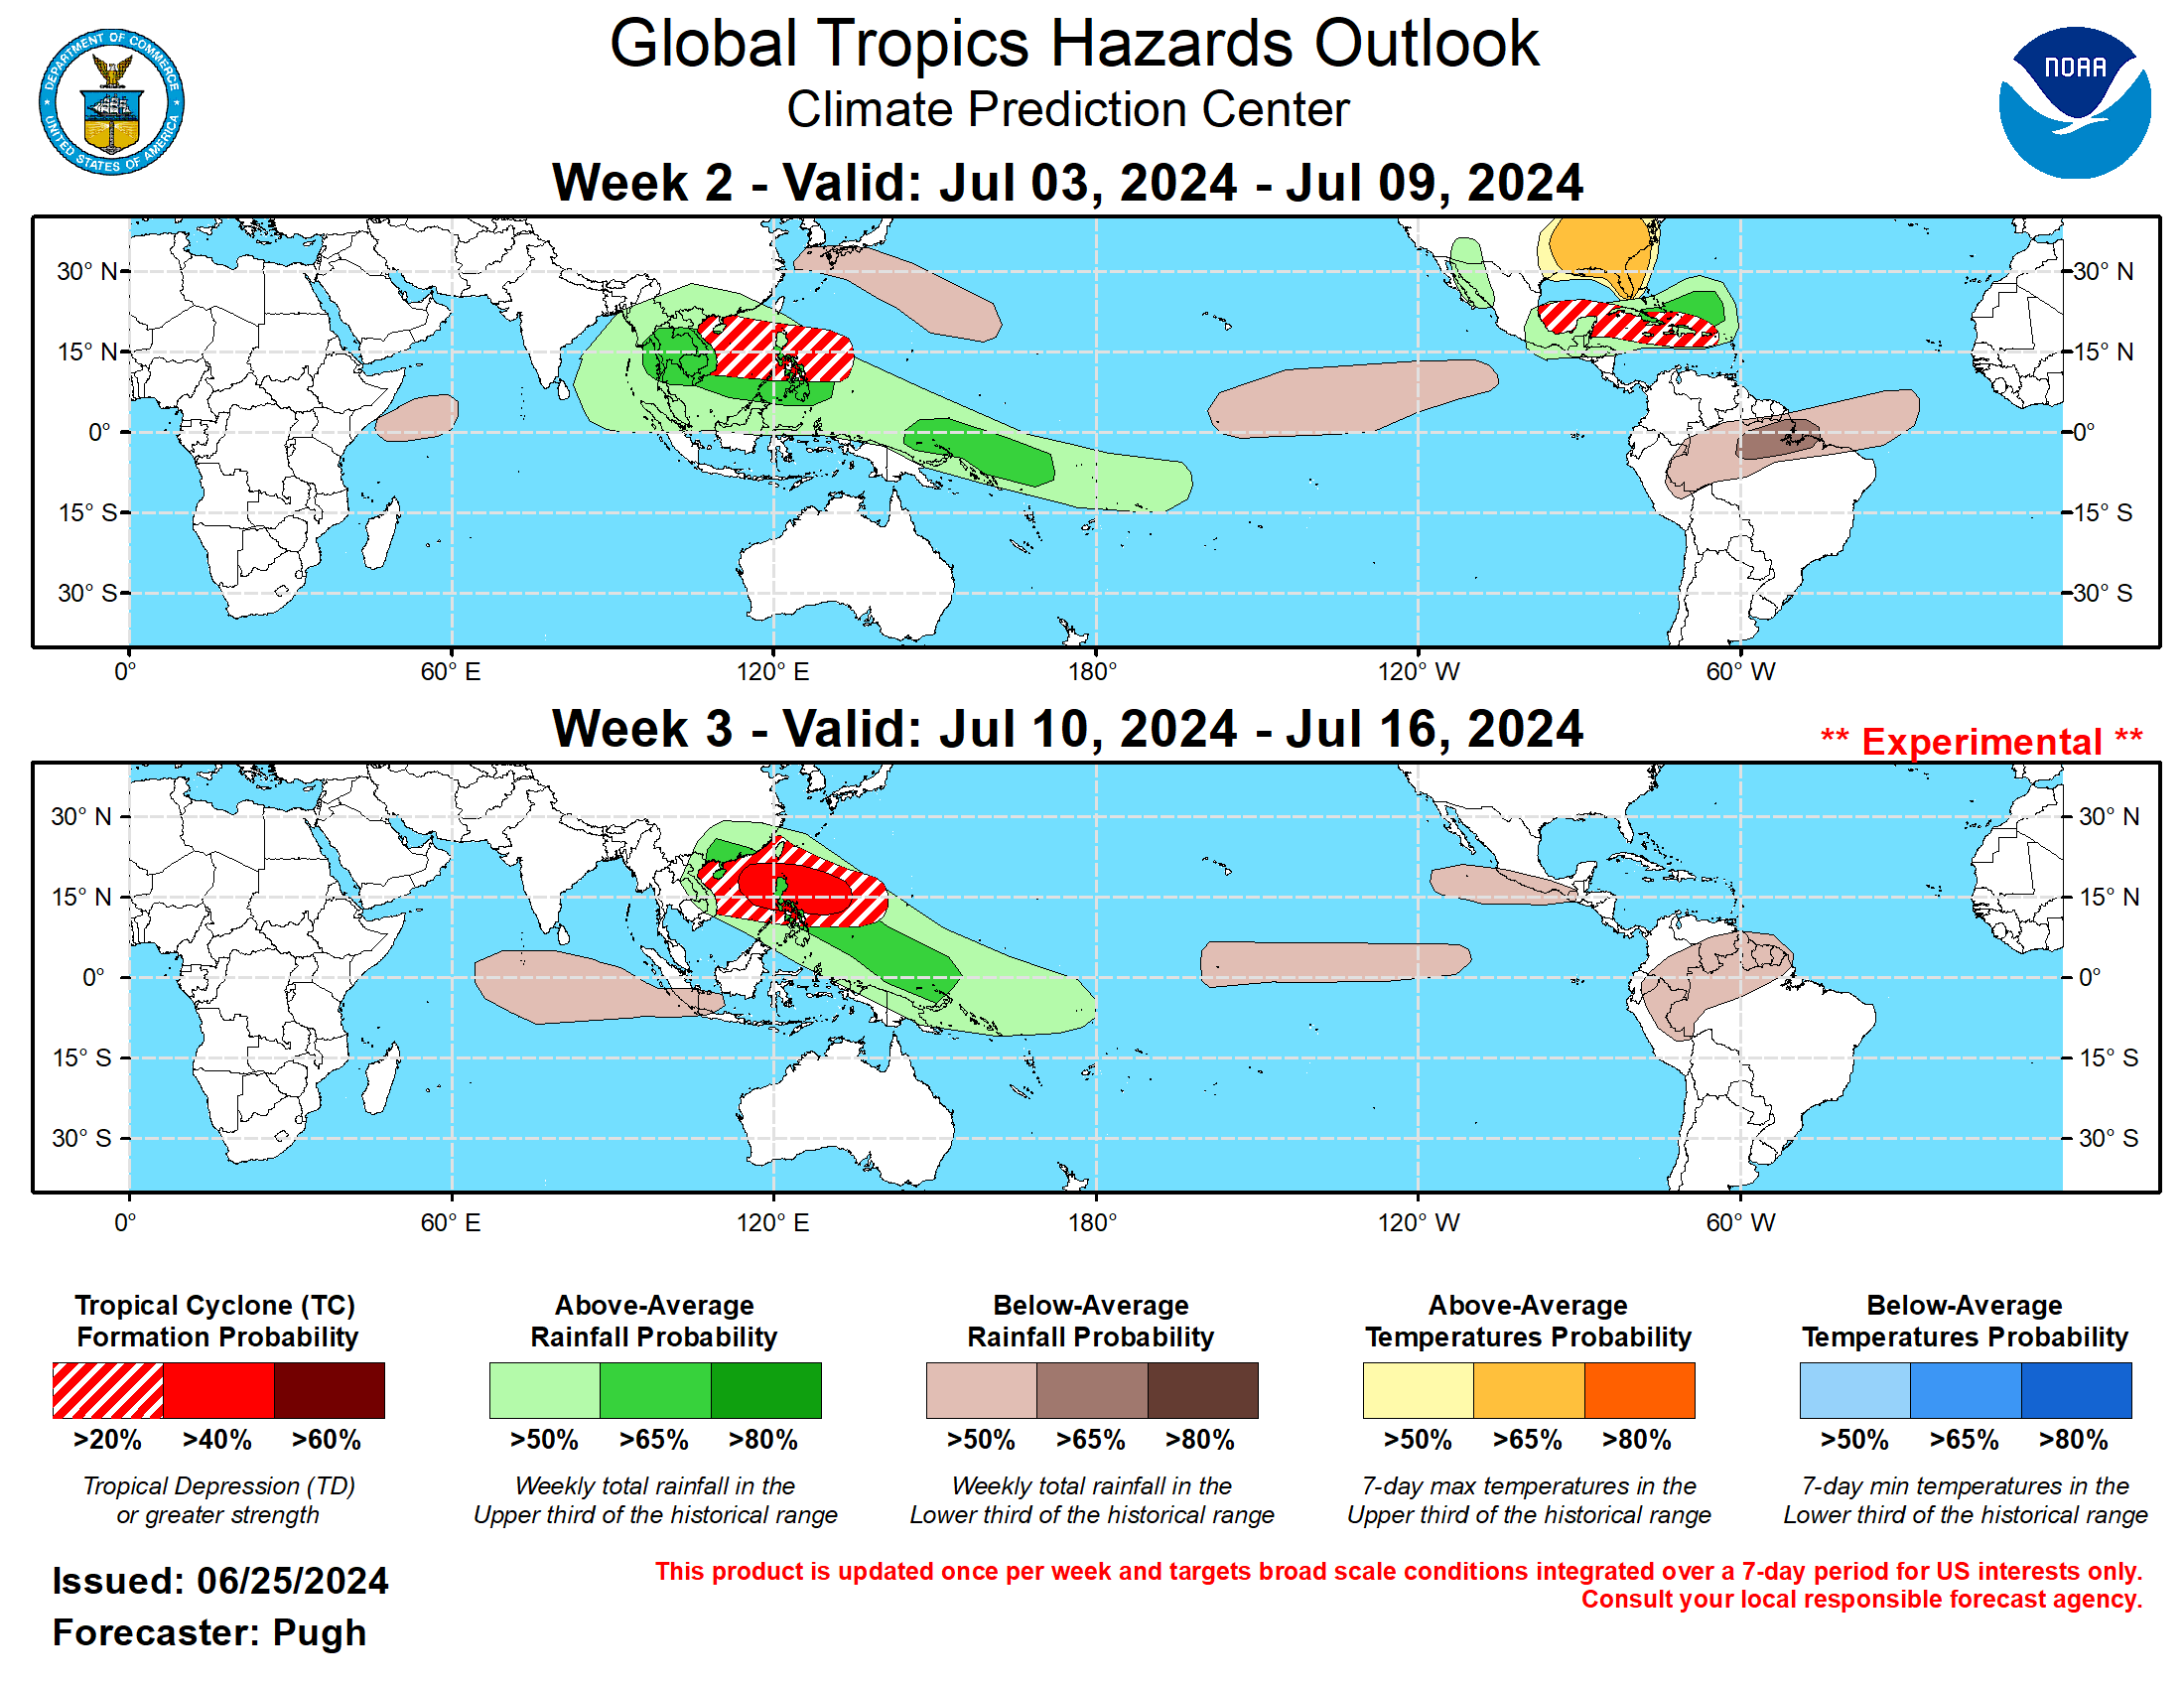
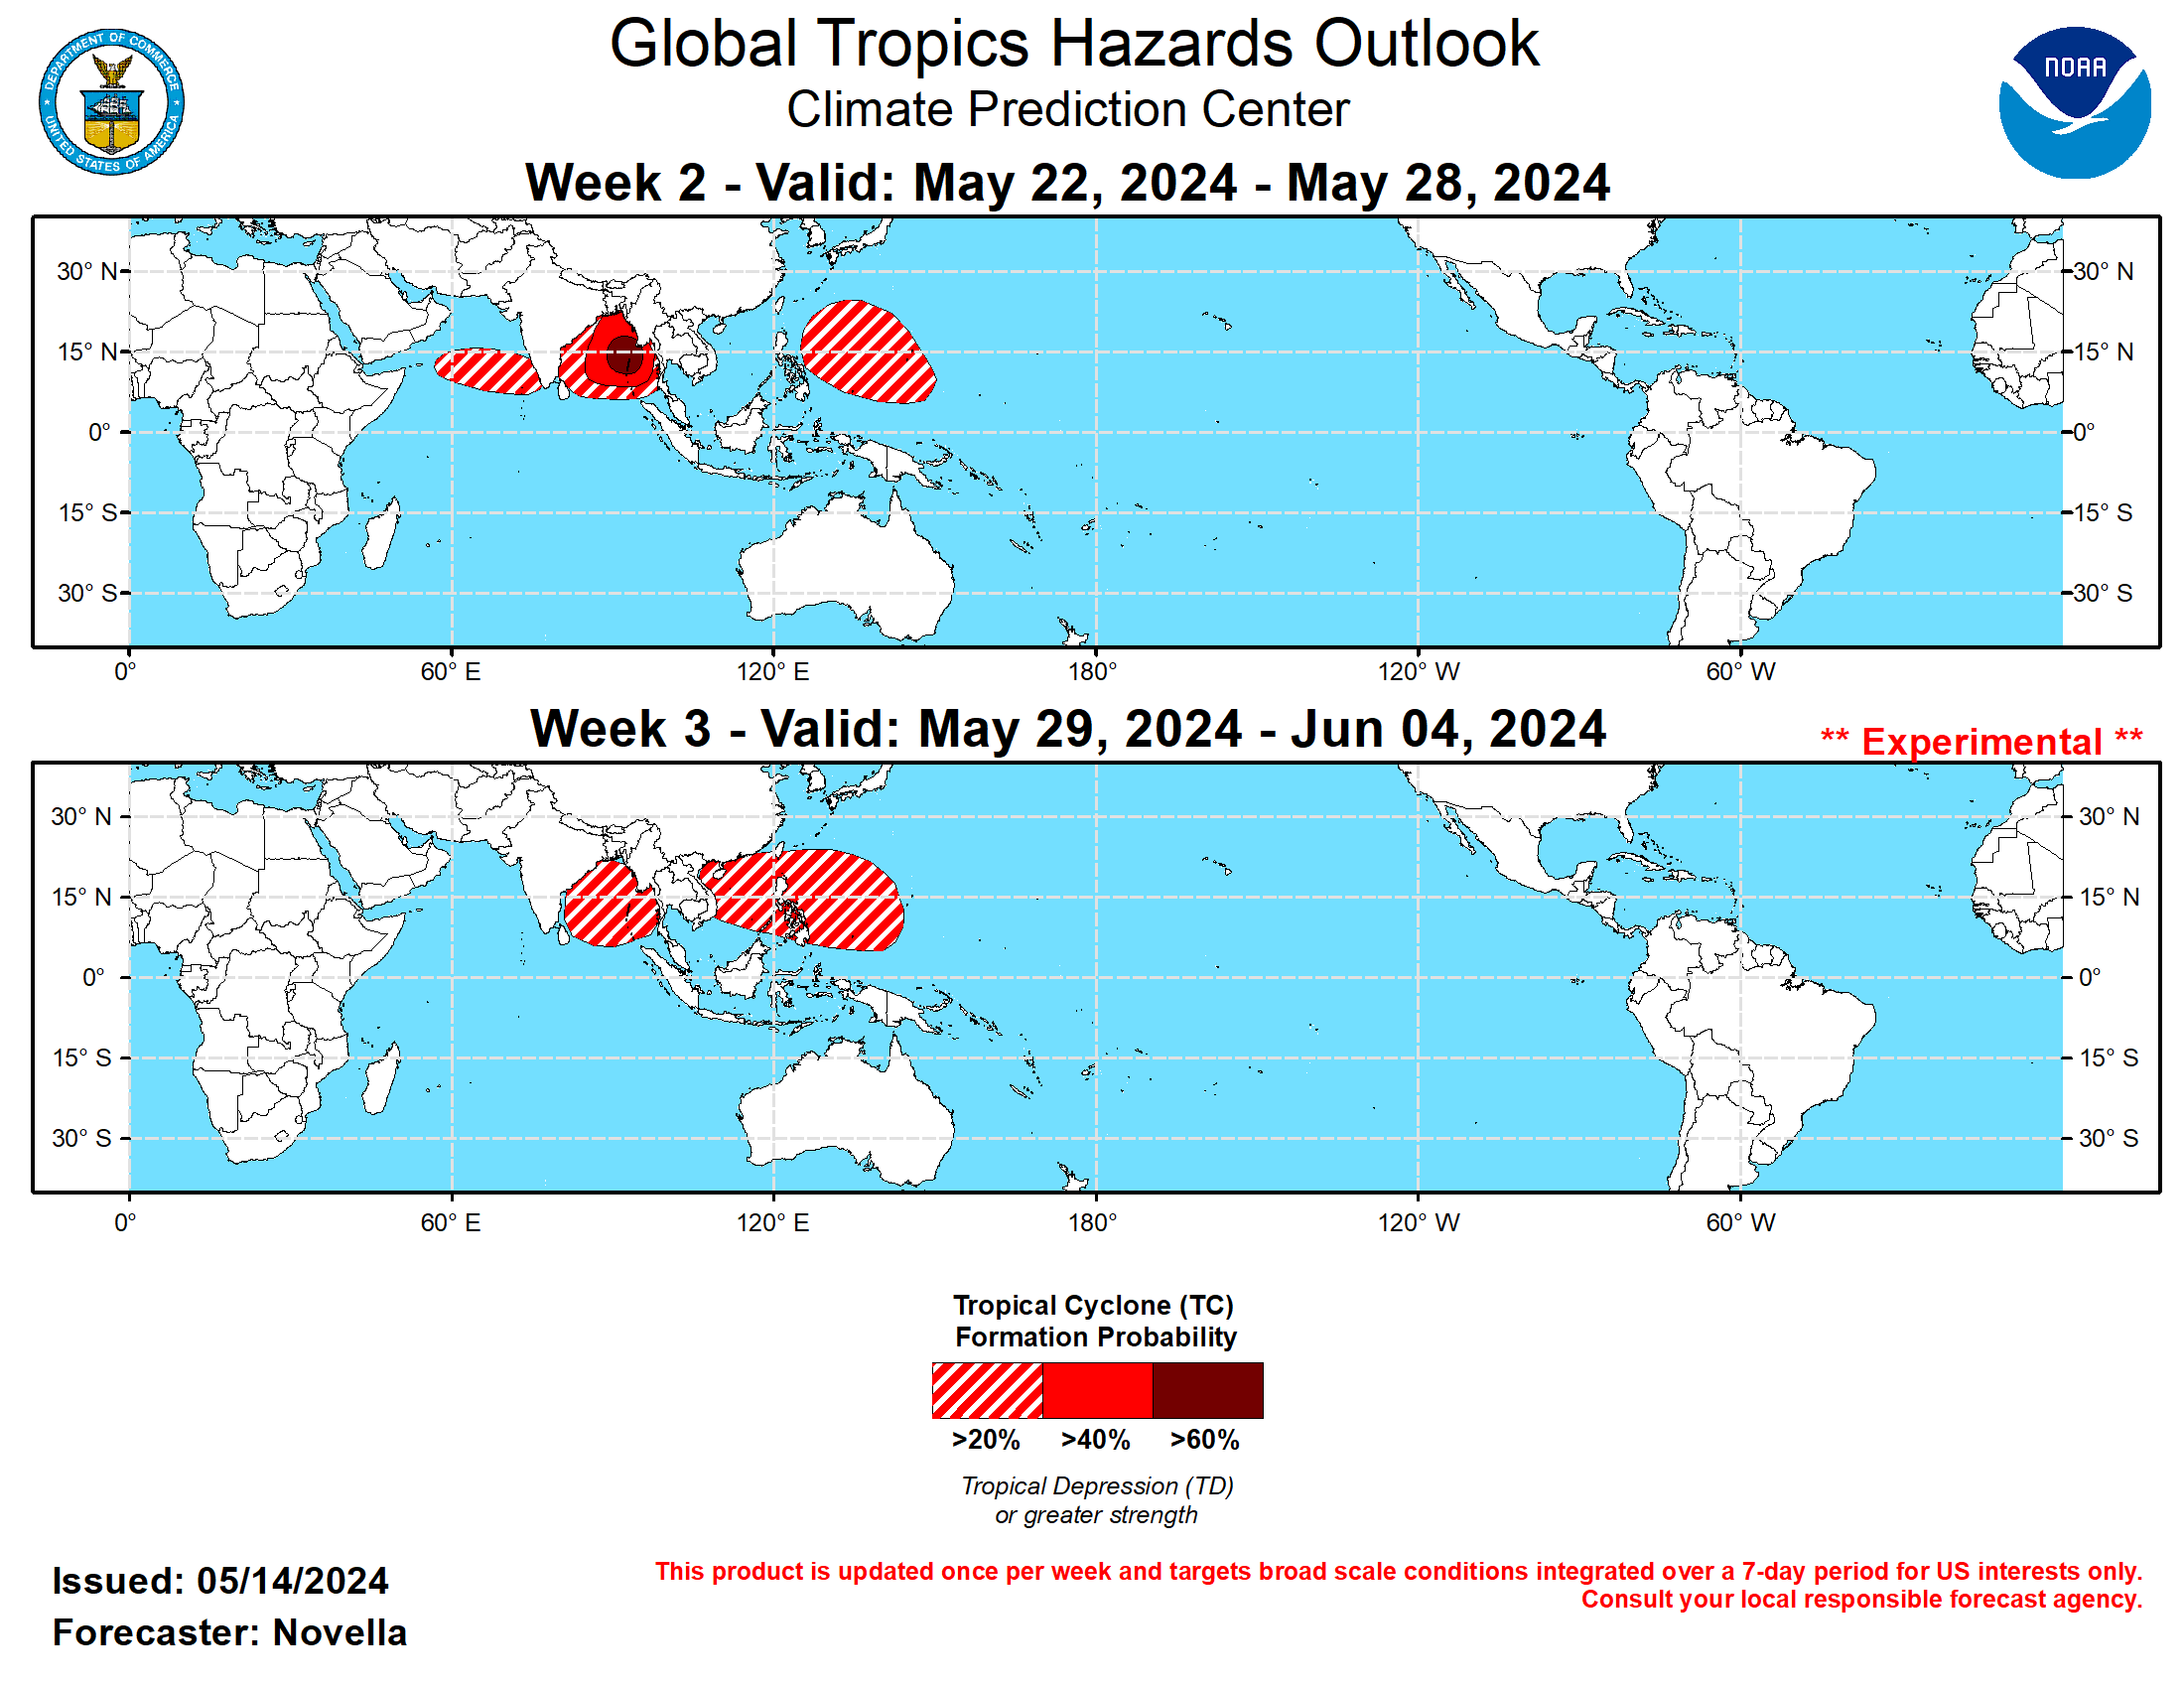
No TCs formed during the past week. Within a band of anomalous lower-level westerlies that is favored to develop south of the equator from approximately 95E to 160E during week-1, probabilistic TC genesis tools continue to feature increased chances of formation to the north of Australia. While TC development appears most likely in the Timor Sea during week-1 based on these tools, the persistence of lower-level westerlies would support additional development to the north of Australia and into the South Pacific where 20% chances are highlighted for week-2. A secondary 20% area for TC development is also posted for week-2, centered near 95E in the southern Indian Ocean given increased support in the guidance for a deepening low late in week-1. For week-3, late April marks the climatologically quietest time of the year for TC activity throughout the global tropics, with genesis becoming more limited over the southern Indian Ocean, southern and western Pacific. While this would favor no TC areas being posted, 20% chances are again issued to the north of Australia and into the South Pacific based on continued elevated signals in the probabilistic TC genesis tools over the basin. 20% chances were also considered for the northwestern Pacific, however, guidance suggests the mean shearing environment not being as favorable north of the equator towards the end of April, with better support for genesis in the basin after the start of May.
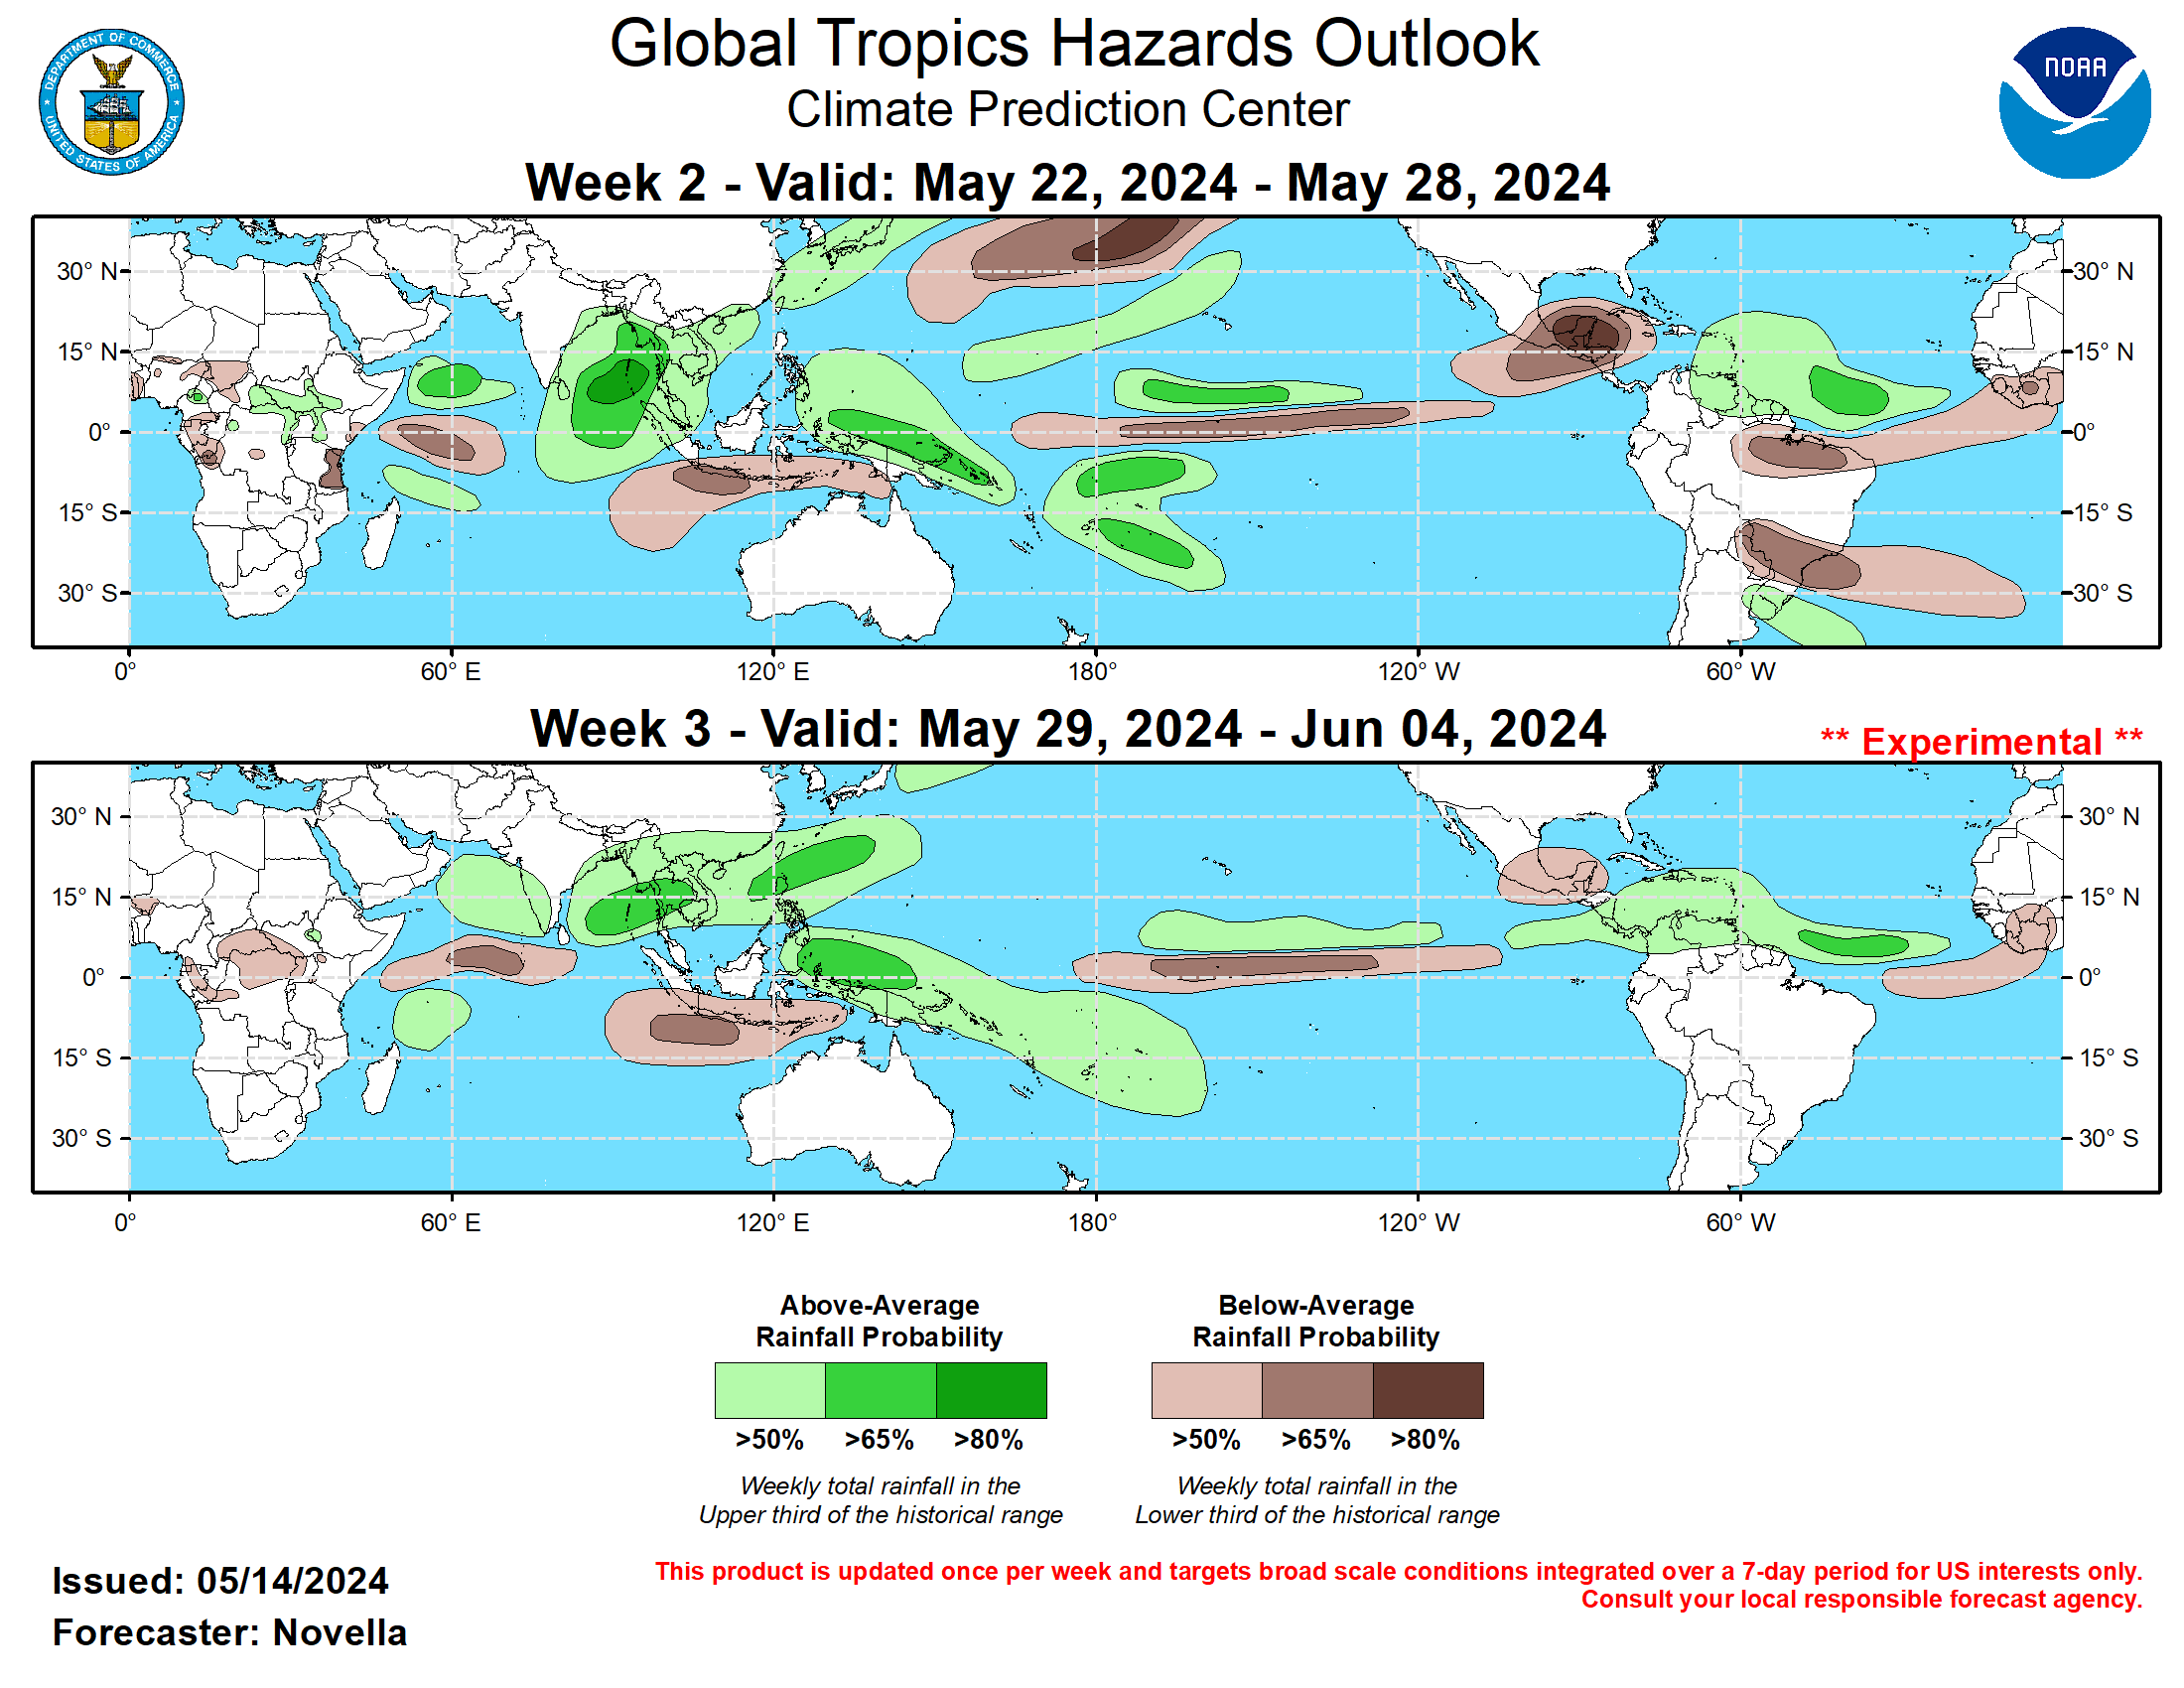
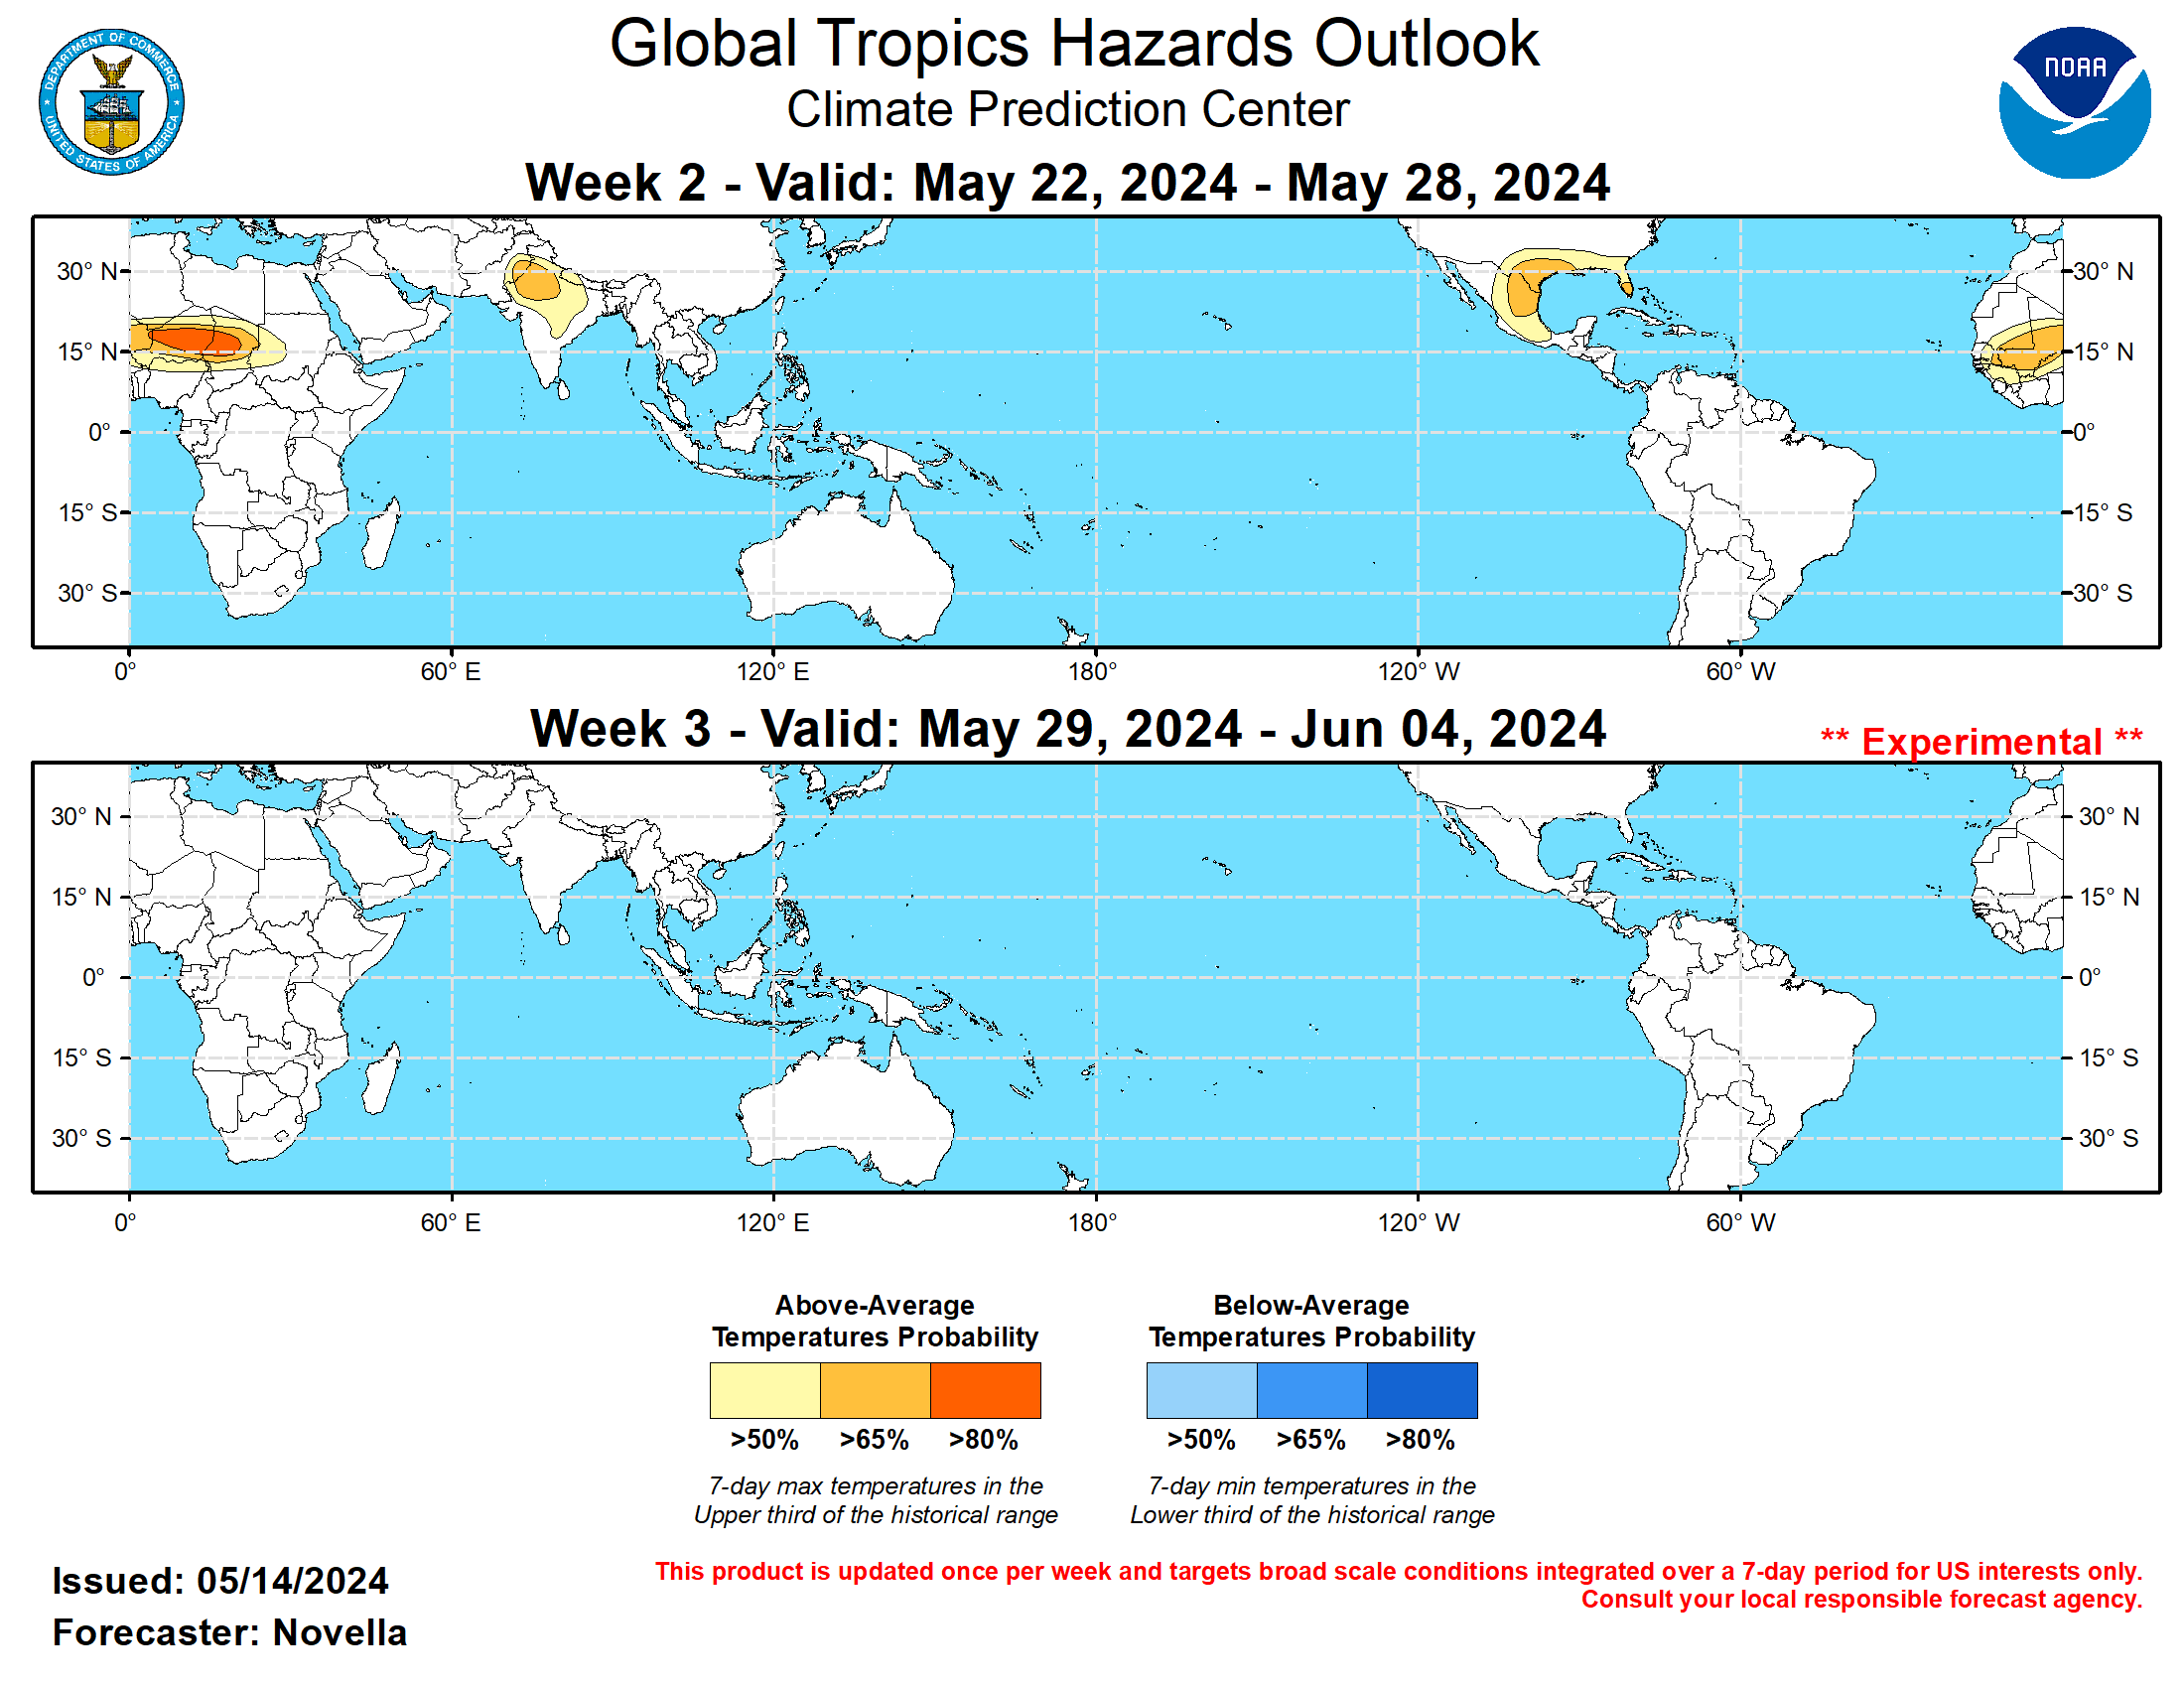
Forecasts for enhanced and suppressed precipitation are mainly based on a consolidated skill weighted blend of GEFS, CFSv2, and ECMWF ensemble systems, anticipated TC tracks, with less reliance on seasonal MJO and ENSO composites for Mar-May due to uncertainty with evolving subseasonal activity, and the unusual base state, respectively. Above-normal temperatures are favored over parts of Afghanistan, Pakistan and northwestern India, with daytime maximum temperatures possibly exceeding 100 deg F during week-2. While cooler, above-normal temperatures are also favored for Hawaii and parts of the Great Basin of the contiguous United States (CONUS). Forecasts for Africa are made in coordination with the CPC International Desk. For hazardous weather concerns in your area for the next two weeks, please refer to your local NWS office, the Medium Range Hazards Outlook issued by the Weather Prediction Center, and the CPC Week-2 Hazards Outlook.
|
Product Release Information
The Global Tropics Hazards Outlook (GTH) is released once per week every Tuesday at 1730 UTC (1830 UTC when on standard time) including U.S. federal holidays.
At the time of product release, there is a live briefing (available via Google Meet) open to all stakeholders where the latest conditions and the newly
released outlook are shared with the opportunity to ask questions. Folks that are interested in learning more or attending these briefings should contact
Jon.Gottschalck@noaa.gov, Scott.Handel@noaa.gov, Adam.Allgood@noaa.gov and Nicholas.Novella@noaa.gov for the required information. Each weekly outlook and GTH release briefing is
Archived and available on the website.
|
Product Description
The Global Tropics Hazards Outlook is a probabilistic forecast for areas with elevated probabilities for above- or below-median rainfall, above- or below-normal
temperatures and regions where tropical cyclogenesis is favored for the upcoming Week-2 and Week-3 time periods. The rainfall outlook is for precipitation
integrated over a week and targets broad-scale patterns, not local conditions as they will be highly variable. Above (below) median rainfall forecast areas are
depicted in green and brown respectively. Above (below) normal temperature forecast areas are depicted in orange and blue respectively. Favored areas for tropical
development are shown in red. Three probability intervals are indicated for precipitation and temperature which are set at 50, 65, and 80%, while the probability
intervals for tropical cyclone development are set at 20, 40, and 60%. The weekly verification period ranges from 00 UTC Wednesday to 00 UTC the following
Wednesday.
Along with the product graphic, a written text outlook discussion is also included at release time. The narrative provides a review of the past week across
the global Tropics, a description of the current climate-weather situation, the factors and reasoning behind the depicted outlook and notes on any other
issues the user should be aware of. The discussion discusses the impacts in the Tropics as well as potential impacts in the Extratropics when relevant.
|
Product Physical Basis
The product synthesizes information and expert analysis related to climate variability across multiple time scales and from various sources, including operational
climate monitoring products. The physical basis for the outlooks include
El Nino-Southern Oscillation (ENSO) , the Madden-Julian Oscillation (MJO),
strength and variations of the monsoon systems, other coherent subseasonal tropical variability such as atmospheric Kelvin waves (KW), Equatorial Rossby waves
(ERW), African easterly waves, as well as interactions with the extratropical circulation (i.e. high latitude blocking, low-latitude frontal activity, etc.).
|
Product Forecast Tools
The outlook maps are currently based on a number of forecast tools, many of which are objective and serve as an objective first guess. The final depiction is an
assessment of these objective forecast tools augmented by the forecaster when based on additional forecast information when appropriate to create the final product.
Forecast tools include MJO composites, empirical and dynamical based MJO, ERW and KW forecasts, and bias-corrected dynamical model guidance from a number of modeling systems.
Tropical cyclone areas are based on MJO composites and statistical and dynamical tropical cyclone forecast guidance products as well as raw model forecast guidance.
|
Product Purpose
The product supports the NOAA mission in three primary ways:
- Assess and forecast important changes in the distribution of tropical convection (i.e., potential circulation changes across the Pacific and North America sectors) and communicate this information to NWS forecasters
- Provide advance notice of potential hazards related to climate, weather and hydrological events across the global tropics (including tropical cyclone risks for several NWS regions)
- Support various sectors of the U.S. economy (finance, energy, agriculture, water resource management) that have foreign interests.
|
Product Partners
The product is created through collaboration with other NOAA centers, [the National Hurricane Center (NHC) and the Central Pacific Hurricane
Center (CPHC)], the Department of Defense [The Joint Typhoon Warning Center (JTWC) and the Naval Postgraduate School (NPS)],
the Australian Bureau of Meteorology, Taiwan Central Weather Bureau, the State University of New York at Albany (SUNY) and the Center
for Climate and Satellites (CICS), among other collaborators.
|
Product Users and Applications
Known users include U.S. government agencies such as NOAA [National Weather Service (NWS), River Forecast Centers (RFCs), the National
Marine Fisheries Service (NMFS), the Department of the Interior (U.S. Forest Service), aid organizations (U.S. and international Red Cross,
USAID), domestic and global private sector interests (financial, energy, water resource management and agricultural sectors),
international weather services and various media meteorologists.
Some special applications of the product in the past include extended range predictions to support Haiti earthquake and Deepwater
Horizon oil spill relief efforts as well as support for the Dynamics of the MJO (DYNAMO) scientific field campaign held from
October 2011 through March 2012.
|
Product Resources
|
|
Feedback and Questions
|
|


