 |
Sea Surface Temperature and Sea Level From Eastern Pacific
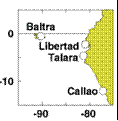
GOES Stations
David B. EnField, NOAA/AOML
Instituto Oceanografico de la Armada Guayaquil, Ecuador
Direccion de Hodrografia y Navigacion de la Marina, Callao, PERU
DECEMBER 2009
|
Through
cooperative arrangements with South American institutions, the TOGA
program has maintained a network of nine tide stations and four
meteorological stations in Ecuador, Peru and Chile since the mid
1980's. The stations are maintained by NOAA/AOML and the University of
Hawaii. The hourly data are transmitted to down-link stations via the
GOES satellite in real time and processed. The five-day averages
(pentads) at critical stations give us an effective means of monitoring
coastal conditions with good time resolution and compact data volume.
|
|
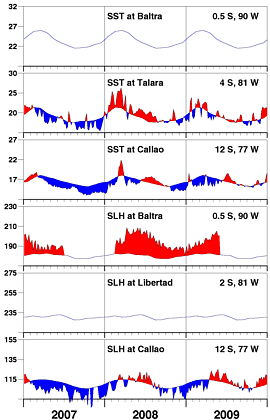
Late November saw a rise in sea level at Callao and two weeks later came a
2+C anomalous warming at Talara, and in the last week of December the warming
reached Callao. We have learned, however that even with almost 2 months of
2+C conditions offshore, Guayaquil has still seen no rain, unusual for the
warm season.
|
| |
|
Day of   Sea Sfc Temperature    Sea Level Height (cm)
 Dec     Baltra Talara Callao   Baltra Libertad Callao
------   ------ ------ ------   ------  ------  ------
   4       **    20.4   15.4       **      **    117.0
   9       **    21.5   15.9       **      **    113.8
  14       **    21.2   16.0       **      **    117.2
  19       **    21.0   16.2       **      **    115.6
  24       **    21.3   17.3       **      **    119.7
  29       **    21.3   18.6       **      **    118.9

                       Anomalies
   4       **     1.9   -0.6       **      **      8.9
   9       **     2.9   -0.2       **      **      5.5
  14       **     2.5   -0.2       **      **      8.6
  19       **     2.2    0.0       **      **      6.6
  24       **     2.2    1.0       **      **     10.2
  29       **     2.0    2.3       **      **      8.9

For further information contact David.Enfield@noaa.gov
 or go to http://www.aoml.noaa.gov/phod/epac/
 ** - Data missing due to hardware failure
|
FIGURE A1.5
Five-day averages of Sea Surface
Temperature (SST, C) and Sea Level Height (SLH, cm) from GOES receiving
stations in Ecuador and Peru. Dashed line and shading show climatology
departures.
|
 |


