 |
Linear Inverse Modeling Forecasts for Nino 3.4 Region
Cecile Penland, NOAA/CDC
JANUARY 2011

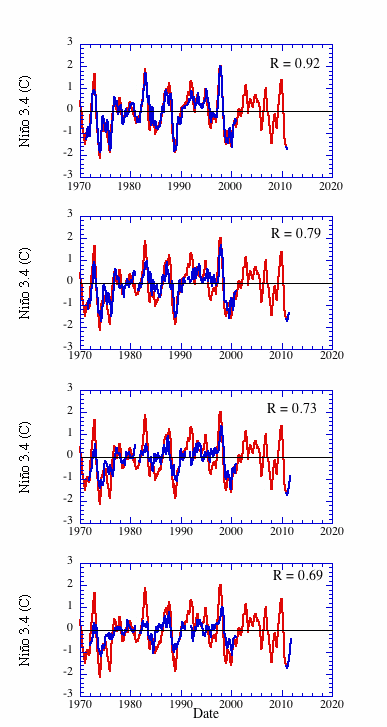
FIGURE F10.
Predictions of Nino 3.4 SSTA (blue solid line) and verification
(solid red line). The Nino 3.44 Index was calculated in the area
6N-6S, 170W-120W. The 1981-2010 climatology was sub-
tracted from ERSST data between 1950 and 2010, after which
they were projected onto 20 EOFs containing 90% of the
variance. Significant 1950-2010 trends were subtracted from
the corresponding PCs, the forecast was made on the detrended
anomalies, after which the trend was added to the forecast.
Cross-validated forecasts for 2001-2010 are not shown
because that decade was necessary to get a good
estimate of the trend, thus precluding legitimate cross-
validation. Cross-validated forecasts shown before 2001
use trends estimated using data outside the verification
period.
|
 |


