|
| |
|
HOME > Monitoring and Data > Monitoring Weather & Climate > Indices and Forecasts > Daily North Atlantic Oscillation Index
|
| |

|
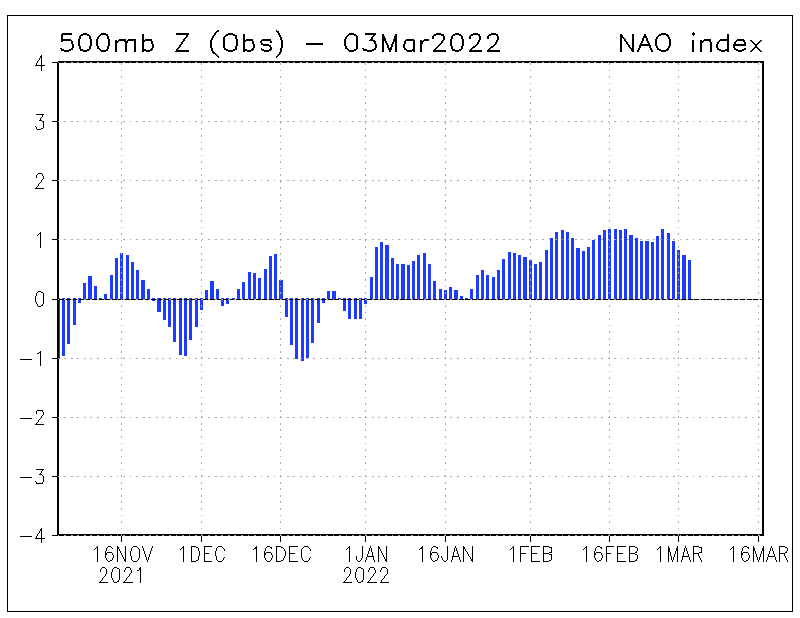
The daily NAO index is constructed by projecting the daily (00Z) 500mb height anomalies over the Northern Hemsiphere onto the loading pattern of the NAO. Please note that all year-round monthly mean anomaly data has been used to obtain the loading pattern of the NAO (Methodology). Since the NAO has the largest variability during the cold season, the loading pattern primarily captures characteristics of the cold season NAO pattern.
The daily NAO index and its forecasts using MRF and Ensemble mean forecast data are shown for the previous 120 days as indicated and they are normalized by standard deviation of the monthly NAO index from 1950 to 2000. A 3-day running mean is applied for the forecast indices.
|
| |
|
Observations
|

|
|
|
|
- Monthly mean NAO index since January 1950
|
|
|
|
|


